Volume-Weighted Price Deviation

The spread is forty basis points. The technical analysis found in the notes at orb trading sp 500 a by p covers volume-weighted price deviation as a method to identify momentum exhaustion in the S&P 500. Traders use this math to see if the current price has drifted too far from the mean during regular trading hours. When the price sits too high above the volume-weighted average price, the buying pressure often lacks the depth to sustain the move. This measurement provides a mechanical way to judge if a trend is overextended.
Calculating the Deviation
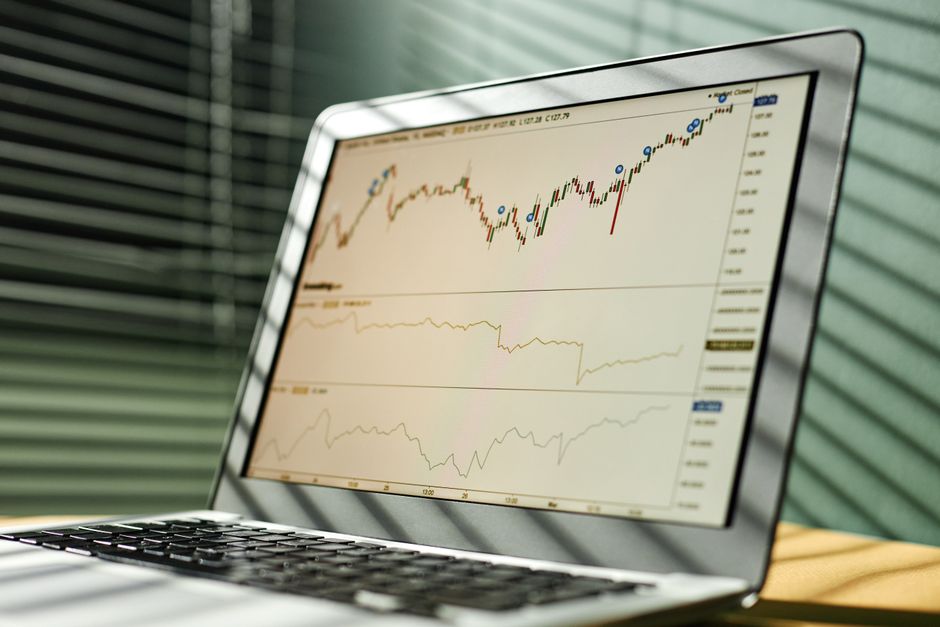
The calculation requires the sum of every price multiplied by its volume, divided by the total volume for the period. This creates the baseline. To find the deviation, subtract the VWAP from the current market price. This distance is not a static number. It changes based on the volatility of the session. A large deviation during the first hour often signals that the initial move is reaching a limit. You must track this distance relative to the standard deviation bands to confirm if the price is truly an outlier or just moving within a normal channel.
Identifying Trend Exhaustion

Exhaustion occurs when the price moves into a zone where volume can no longer support the current trajectory. If the price spikes rapidly away from the VWAP during the opening range breakout, the move is often a trap. Look for the price to stall when the deviation reaches a historical extreme for that specific timeframe. If the price reaches a new session high while the distance from the VWAP is widening at a decreasing rate, the momentum is fading. This is a mechanical signal that the current direction lacks conviction.
Timeframe Application
The utility of the deviation depends on the selected timeframe. Using a 5 minute chart allows for quick identification of micro-extensions, but these often fail during high volatility. A 15 minute range provides a more stable view of where the bulk of the volume is actually transacting. For larger trend shifts, analyzing the deviation on a 60 minute scale helps filter out noise from the market open. Each interval offers a different level of sensitivity to the price-volume relationship.
Execution and Context
Do not trade the deviation in isolation. A price far from the VWAP can stay far from the VWAP for a long time in a strong trend. Combine the deviation check with the opening range to see if the price is returning to value or simply consolidating. If the price breaks the opening range but the deviation is already at a maximum, the probability of a reversal increases. Watch how the price reacts at the cash open to set the initial parameters for the day.