Relative-Volume-Threshold-Validation
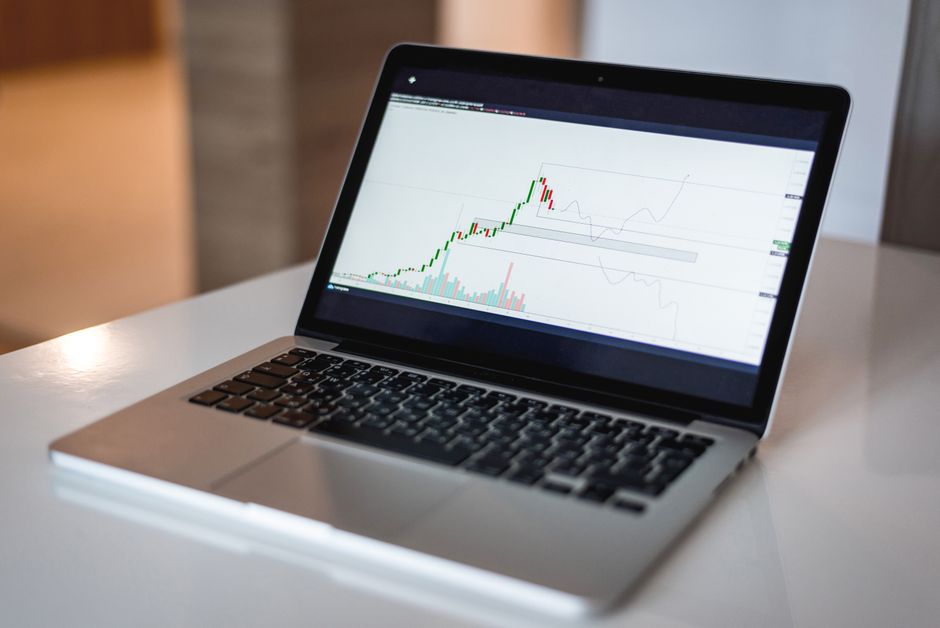
Monitor the volume bars during the first fifteen minutes to verify liquidity depth, as the data compiled at orb trading sp 500 a by p tracks every opening range breakout with mechanical precision. The volume at the market open must exceed the standard deviation of the previous five trading days to confirm a valid trend. High volume during the initial minutes of the session indicates that institutional orders are actively moving the price. Without this specific validation, a price move lacks the necessary participation to sustain momentum through the morning session.
Relative Volume Calculation Methodology

The process begins by calculating the average volume for a specific time frame over the previous five sessions. If the objective is to validate the 5 minute range, the volume from the first five minutes of each of the last five days must be summed and divided by five. This establishes a baseline for normal activity. The current volume at the opening bell is then compared directly to this baseline. A threshold of two hundred percent of the five day average is the standard requirement for a high conviction setup. Anything less suggests a lack of conviction in the direction of the move.
Timeframe Specificity in Validation

Different intervals require different scrutiny. A fifteen minute range requires a larger volume footprint to justify a breakout. For those monitoring the thirty minute range, the volume must show a consistent buildup rather than a single spike. The data shows that a sudden burst of volume during the first hour often dictates the direction for the remainder of the regular trading hours. If the volume stays flat against the historical average, the price action is likely noise or a mean reversion attempt rather than a structural shift. The comparison must be interval to interval to maintain accuracy.
Filtering False Breakouts
A price move without volume validation is a trap. During the cash open, price often drifts into a zone before the real volume arrives. If the volume does not spike during the specific timeframe being measured, the breakout is discarded. Using the sixty minute range as a filter helps identify when the initial volatility settles into a trend. The mechanical rule is simple. Volume must lead price. If price moves and volume lags, the setup fails the relative volume threshold check. This prevents entry into low liquidity environments where slippage erodes the edge.
Data Integrity and Execution
The calculation relies on clean data from the premarket to ensure no gaps in the volume profile. Comparing current intraday volume to the five day average provides a mathematical basis for the trade. A small sample overstates the edge. Therefore, the five day lookback is the minimum requirement for a stable mean. The volume bars must be inspected at the close of each specific interval to confirm the threshold was met. This systematic approach removes guesswork from the execution process.